Visual Chart Professional
All the power an active trader needs. Real-time information on the world's main markets and sophisticated stock analysis tools to implement your trading ideas in a personalized way.
Professional Trading
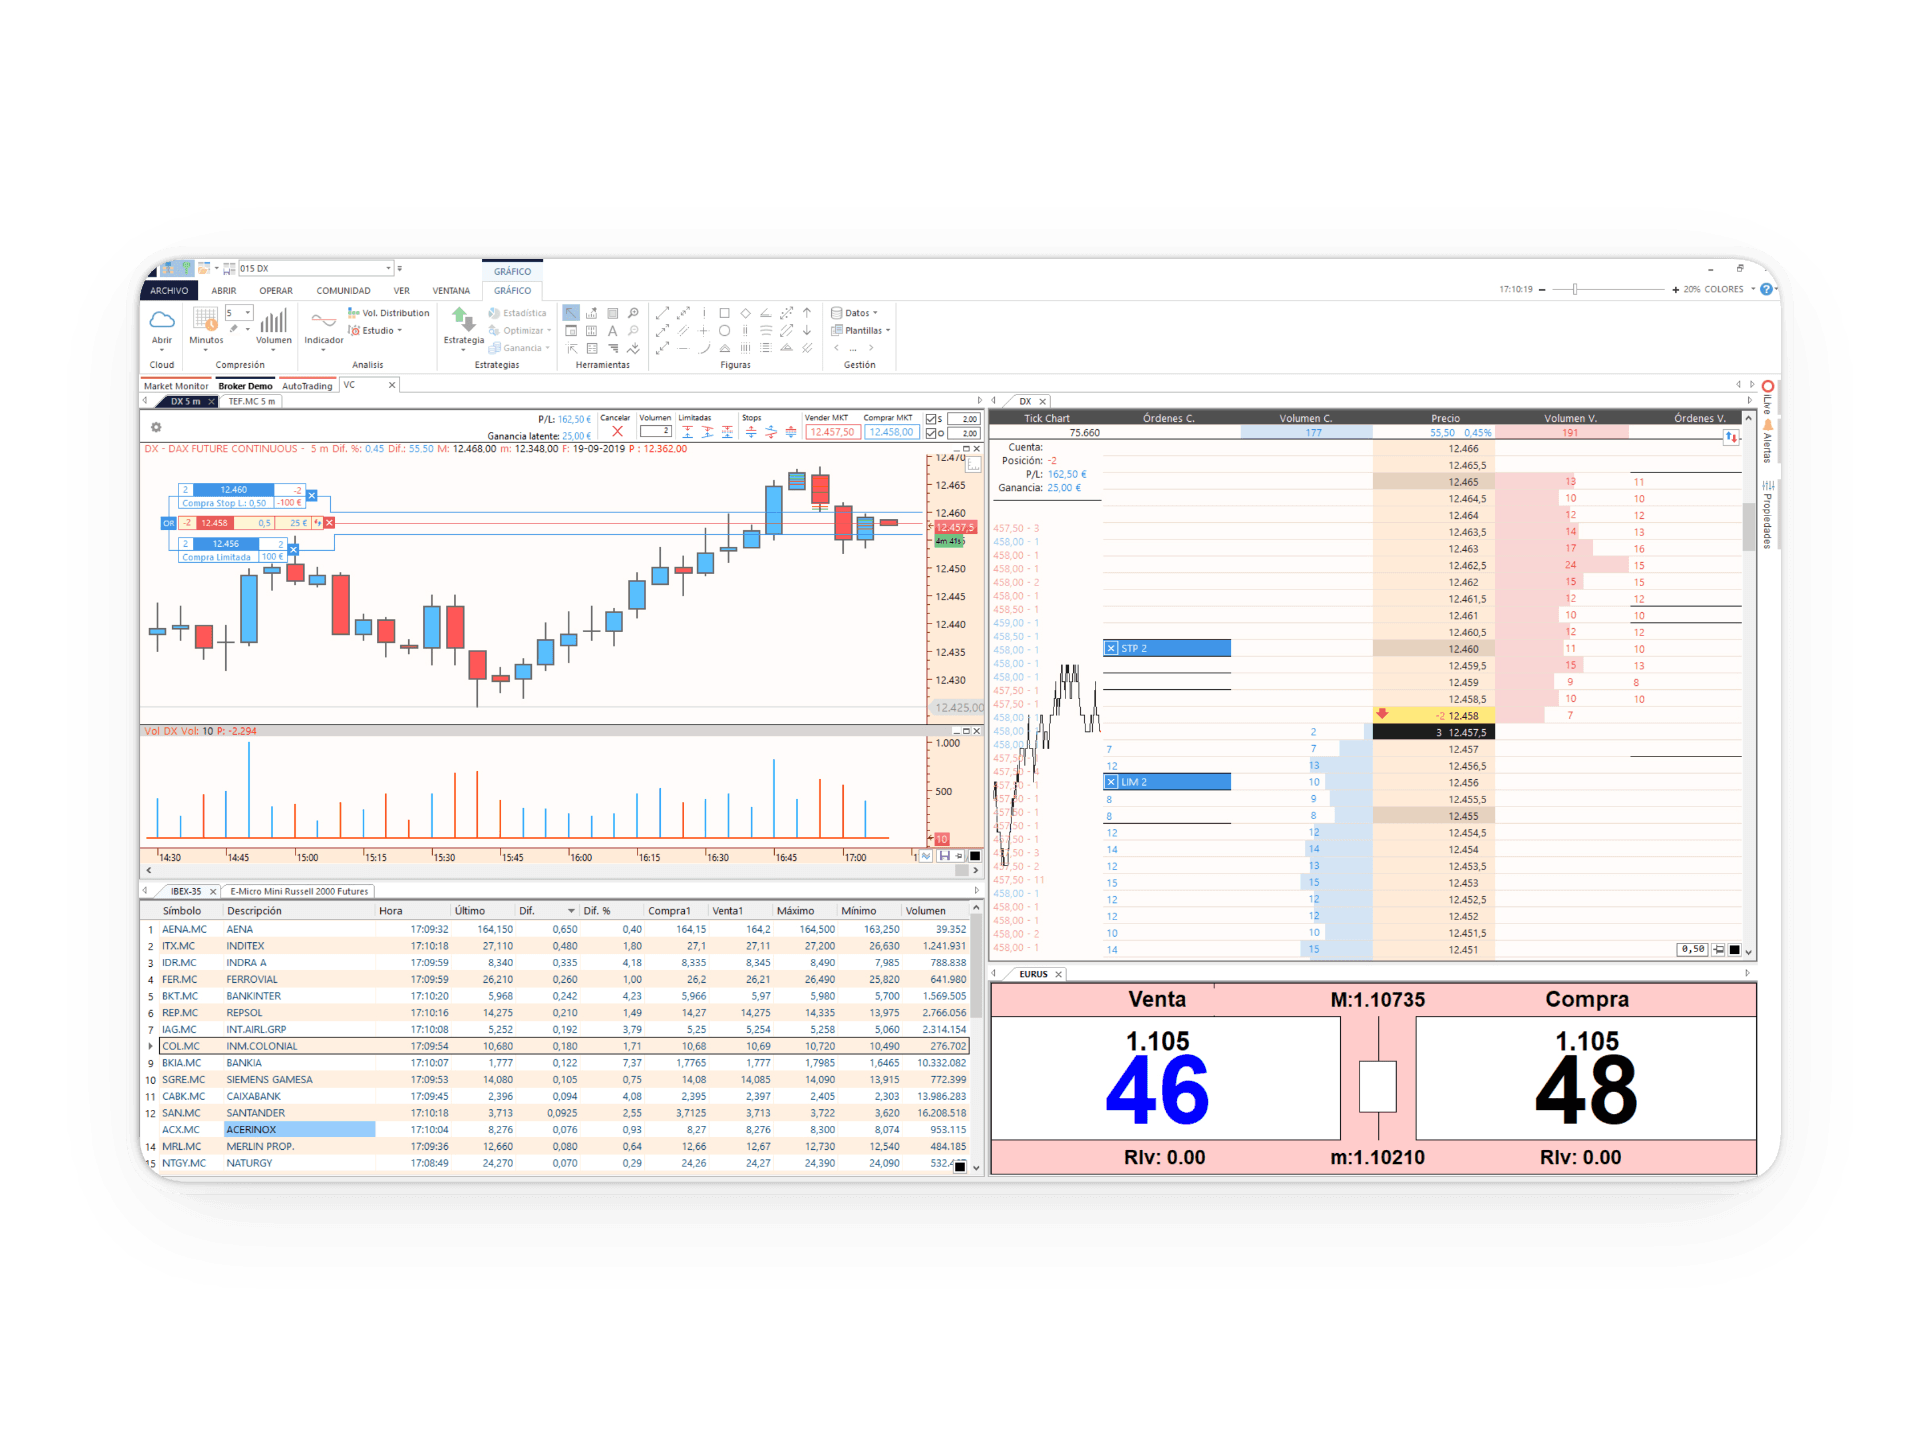
Work like a professional trader with advanced orders and operate agilely by buying and selling directly from the chart, position board, and symbols table. Access the market by sending your orders with hotkeys or simply train before risking your money with the Visual Chart market simulator.
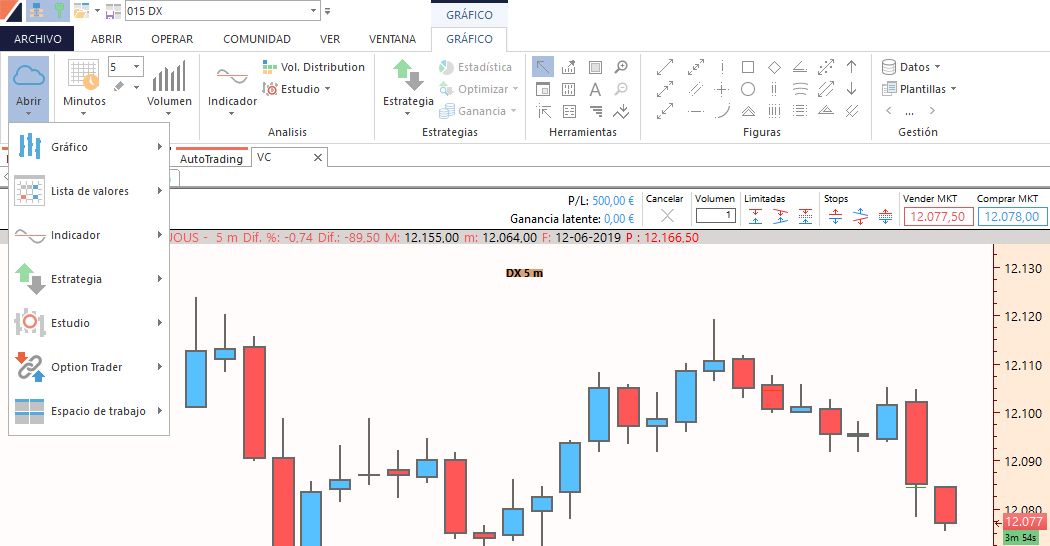
Direct Chart Trading
Buy and sell with a single click from the chart or the depth-of-market window. Use hotkeys for instant execution and train your strategies risk-free in our simulator before jumping into the real market.
Scalable Power
Launch simultaneous orders across different accounts or combine multiple assets in a single operation. Modify prices, order types, and contract volumes in real time with total flexibility and control.
Total Ubiquity
Your trading always with you. Synchronize orders, balances, and positions in real time between Visual Chart Desktop, Web, and App. Monitor your losses, gains, and buying power from any device.
Advanced Algorithms
Define complete entry and exit strategies with order types like Trailing Stop, OCO, OSO, and Bracket. Automate your risk management directly from the trade ticket without complications.
Real-time streaming data with market depth
We work with several data providers to offer you information from the world's main financial markets in real-time streaming. Asset prices can be viewed in interactive charts, watchlists, depth boards, etc. This information is also available in delayed and end-of-day formats. Furthermore, the extensive database we provide, with over 20 years of history, allows you to analyze quotes with a high level of reliability.
Watchlists give you a global view of the behavior of a set of assets: the last traded price, whether they have gone up or down compared to the previous day, opening price, high and low prices, closing price, trading volume, annual and quarterly returns, etc.
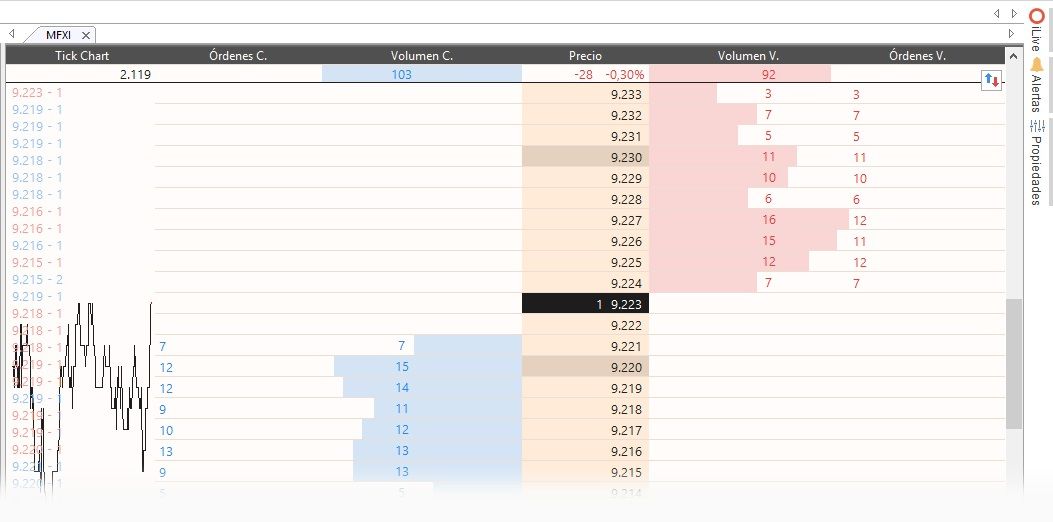
In the depth boards, you can graphically visualize the buying and selling strength of the selected asset at each price level. The positions window also offers information about the buying and selling broker*.
If you want to quickly identify at what price level supports and resistances are forming, the positions on the chart will be very useful. The volume of supply and demand being negotiated at each price level is shown next to the chart's price scale.
Workspaces feature an unlimited number of pages so you can easily manage a large amount of information. The order and size of the windows in the workspace are customizable. As you add new elements, windows automatically reorganize to make the most of your screen size.
The Visual Chart platform is built with a 64-bit multi-tasking architecture to leverage your computer's full power, allowing you to work agilely with as many charts, indicators, trading strategies, tables, and depth boards as you need.
Analysis Tools
The platform integrates a comprehensive set of tools designed to analyze financial markets from multiple perspectives. It allows studying asset behavior through technical indicators, evaluating value using fundamental data, performing visual analysis through advanced charts, and detecting opportunities that fit specific profitability and risk criteria. All of this within a unified environment that facilitates data-driven decision-making.
Technical Analysis
Visual Chart includes over 200 customizable indicators that are stored in the cloud, so you can share them with anyone. You also have access to indicators shared by other platform users. These technical analysis tools, included in the platform at no additional cost, help you detect market trends, determine their strength over time, identify the supply and demand forces of an asset, and measure its risk.
Fundamental Analysis
Fundamental data allows you to calculate the real value of a company to detect the best investment opportunities and make the most appropriate decisions. Financial ratios such as P/E, EV/EBITDA, operating margin, gross margin, ROE, etc., and all information relating to an asset's profitability, year-to-date return, dividend yield, 1-month, 52-week, 5-year return, etc., are at your disposal on the platform at no additional cost.
Chart Analysis
Charting analysis tools allow you to study quotes by drawing supports, regression channels, Fibonacci cycles, retracements, etc. All the chart analysis of an asset can be saved in the cloud, so that every time you open it, its analysis will also be displayed.
Radar
The goal of the Radar tool is to find assets that meet specific profitability and risk objectives. Searches can be performed based on fundamental, technical, structure and volume data, profitability and risk objectives, etc.
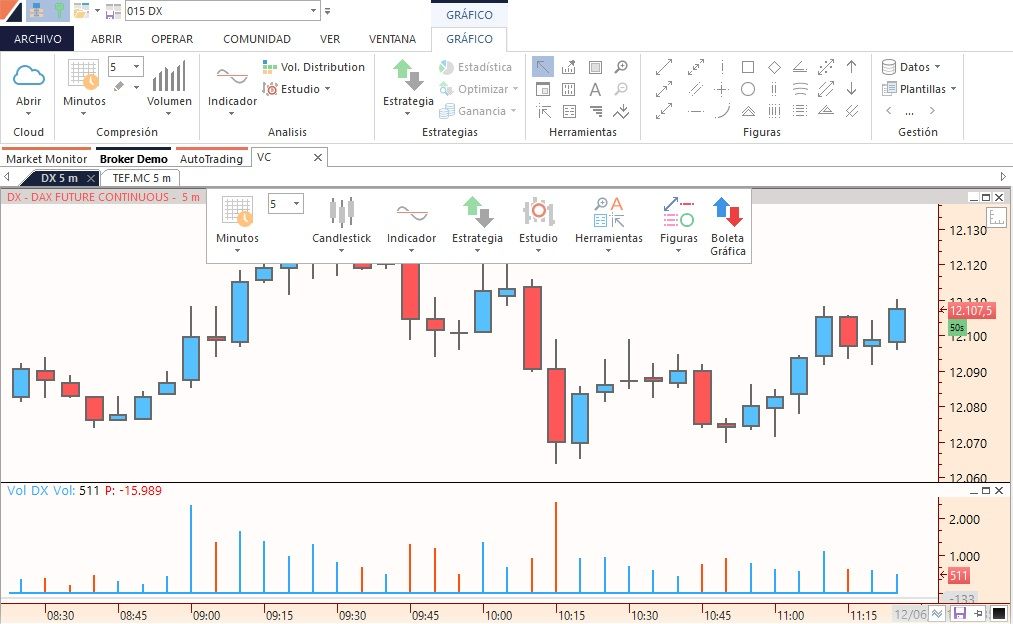
Advanced Charts
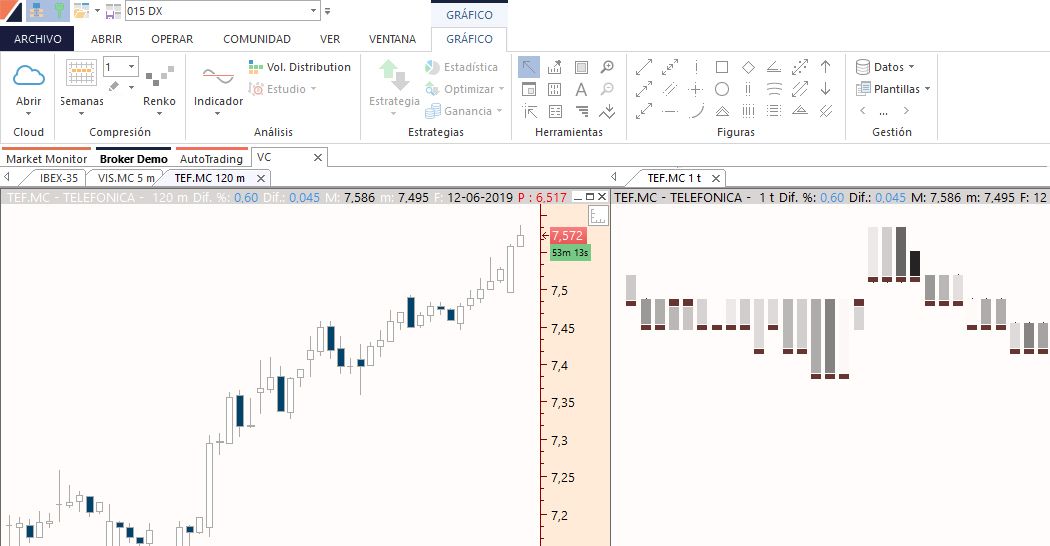
One of the most valued features by Visual Chart users is its powerful charting engine. Information can be displayed in any time unit: 10 ticks, 3 minutes, 1 day, etc., and in different types of graphic representation: Linear, Bars, Japanese Candlesticks, Renko, Three Line Break, among others.
Additionally, it includes the exclusive Limit Chart (in tick compression), which allows for exhaustive analysis by identifying bullish and bearish flows in real time.
The alert service will notify you instantly if an asset reaches a target price or an indicator changes trend.
Your Work in the Cloud
All services and content offered by Visual Chart are designed to be stored in the cloud. Your workspaces, personal settings, indicators, and trading strategies are automatically saved so that you have full accessibility anytime, anywhere.
In addition to having your work available, you can share it with whomever you want: friends, groups, or the entire community. Likewise, you can access content shared by other users, such as new indicators or chart analysis.
All information is encrypted using the AES256 algorithm, and we use the HTTPS protocol with 2048-bit certificates to protect data exchange over the network.
Automated Trading Strategies
Visual Chart trading strategies help you automate your operations and reduce delays that occur when entering and exiting the market manually. You can react more quickly to opportunities, as your strategy is constantly monitoring your predefined conditions.
The platform includes the most advanced technology in the development and study of investment strategies.
Visual Basic for Applications .NET
A secure and robust programming language, fully integrated into Visual Chart, that allows you to develop any entry and exit strategy for financial markets. Programming knowledge is required to work with this platform.
Visual Design Platform
The Visual Design platform is a programming assistant developed by Visual Chart that helps you create strategies, indicators, and studies intuitively. You can work with this platform without needing programming knowledge.
Trading Tools
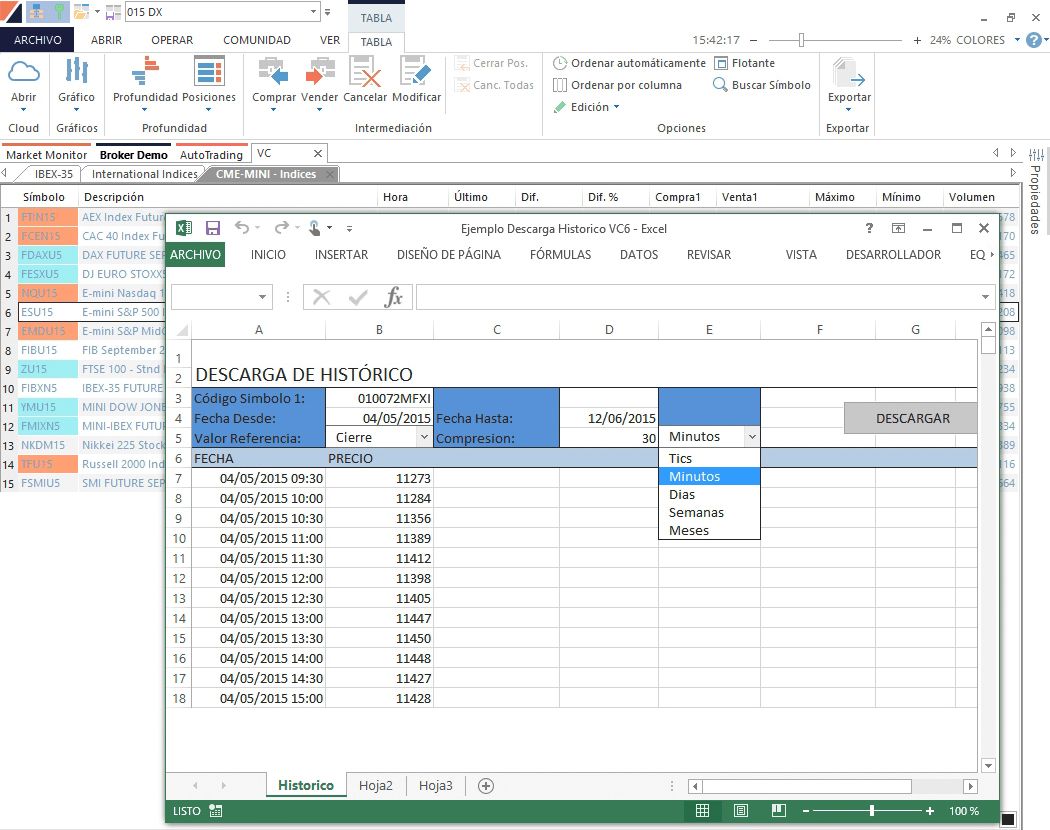
The Trading Tools utility, based on COM (Component Object Model) technology, allows you to access information managed by the program through any development environment compatible with this technology. COM acts as an intermediary between Visual Chart and the client application, such as Microsoft Excel.
This tool is highly useful for accessing real-time information and historical data for any asset, obtaining technical information such as volume, indicators, or system positions, and sending orders to the market.
The platform that adapts to your way of trading
-
Customizable Layouts
Create multiple workspaces and distribute them across several monitors.
-
Market Scanner
Scan the entire market to find assets that meet your criteria in seconds.
-
Smart Alerts
Receive notifications on your mobile or desktop when your conditions are met.
Happy to serve you
Contact us by phone or, if you prefer, send us an email with your question or suggestion and we will respond as soon as possible.